Sign up for our LAVY email
and get our bi-monthly newsletter.

Infographics are a guilty pleasure.
We prefer colorful, bite-sized content to long columns of text. We can’t help it because we’re human and busy; we like quick and interesting things that make us smarter. About 90% of the information sent to the brain is visual; we’re hard-wired to like images and respond to them.
That’s why infographics work—they’re liked and shared on social media more than presentations and documents. But you know that already.
Infographics are especially relevant and tailor-made for the health and beauty retail services industry. By their nature, fitness clubs, massage spas, and hair and nail salons appeal to potential clients on a personal level. Consumers spend discretionary income at these establishments to improve their health, bodies and attractiveness. Infographics about those topics are often inherently more interesting than those about franchise business statistics.
Start here when you’re ready to fire up your marketing strategy with sharable infographics for content.
1. Infographics are meant to be shared, so make it easy for people to do so. Include social media icons at the bottom of your infographic so it can be easily shared on Facebook, LinkedIn, Twitter, Pinterest and email.
2. An infographic should be out one specific thing. Don’t be a generalist. Narrow your topic as much as possible.
3. Make a connection. Other than simply desiring to talk to retail services customers, look for a hook that links your beauty, health, fitness or grooming retail services and products with a season, holiday or event. Best new summer hair styles. Summer safety. Great gym regimens when it’s too cold to be outside. Caring for your skin after removing Halloween makeup.
4. Design for mobile. Half of web traffic originates from phones and tablets. Test infographics on your smartphone. If they don’t look good there, start over. 
5. Design for vertical viewing. New York Times best-selling author Neil Patel says vertical infographics “are tweeted 28.9% more often and are 41.7% more likely to be embedded into other websites” than horizontal designs. Your phone’s screen is vertical. Get it?
6. Size matters. Your infographic should be no more than 600 pixels wide and 1,800 pixels in height. Make sure the file size doesn’t exceed 1.5 megabytes so loading won’t take too long.
7. An infographic is not a brochure. It should not be about your company or retail services franchise location. Focus your content creation on your customers. What are they interested in? What will improve their lives? What will position you as a friend and trusted source for information about retail services? Be sure not to say or do too much. When you have a lot to communicate, consider making a series of connected infographics. You can label them as being part of a series, such as “Part Three: Get the Abs You Deserve.” You’ll send your customers scurrying to find the first two. Finally, strive to present no more than five elements. Infographics typically feature several data points such as statistics, tips or did-you-know lists. Don’t overwhelm people with too much information. Keep it simple. You only have a few seconds to communicate.
8. Tell people something they don’t know. Surprise your customers. If you do, you’ll increase the chances that people will absorb the information about your retail services or products and share it with others.
9. Solve a problem. Great content can help customers (and potential customers) deal with challenges. So, think like your customers. If it’s December and they are gaining weight, consider an infographic that provides tips about navigating the holiday dinner table.
10. Strive for credibility. That means not using an infographic to express an opinion. Respect a customer’s time by being factual. You can look smart and position yourself as an authority by including sources at the bottom of the infographic. While infographics might give the impression of being disposable, they’re not. Take the time to ensure all information is correct. You don’t want spelling and grammar errors to embarrass your company.
11. An infographic should strongly relate to your brand. The fonts, colors and attitude featured in your formal brand standards should also be used in your infographics so that they fit with all your marketing. Don’t forget to include your brand logo, as well. It doesn’t need to be big. Tuck it in a corner. While you’re at it, include your website URL, with a link to your specific franchise location if applicable.
12. Be different. Infographics are the most common type of content produced by business-to-consumer content marketers—see the box below. That’s why you must work hard to cut through the clutter. To stand out, your topic and design should be bold, exciting and filled with charisma. Blandness is not allowed. Show off your category experience.
13. Design for optimal readability. Be sure to make your text sufficiently large for easy readability.
14. Feature a meaningful call to action. An infographic isn’t a classic advertisement, but it should still send a clear “do this” message. If your infographic presents the most popular nail colors, you can say, “Schedule your manicure today.”
Not sure where to start? LAVIDGE, an Arizona franchise content studio, can help you create infographics sure to position yourself as a retail services industry leader.
To learn more, give us a call at 480.998.2600 or send email to [email protected].
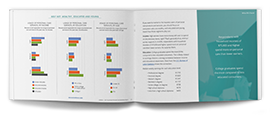
Here are the top types of content produced by U.S. business-to-consumer content marketers. Numbers represent percent of respondents using each tactic.
76% Infographics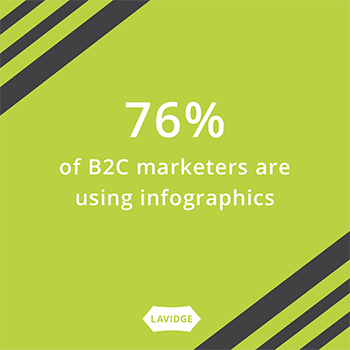
75% Product reviews
74% Research/original data
72% Videos
58% Blog posts
54% Case studies
52% Interviews
51% White papers
38% Podcasts
20% E-books
This article is a brief abstract of our exclusive and authoritative study that takes the guesswork out of advertising and marketing for retail services. Rather than speculating about what will drive consumers to action, we've asked them.
Sign up for our LAVY email
and get our bi-monthly newsletter.